


 6 / 9
6 / 9

Real Estate – Mazaya
December 21, 2015
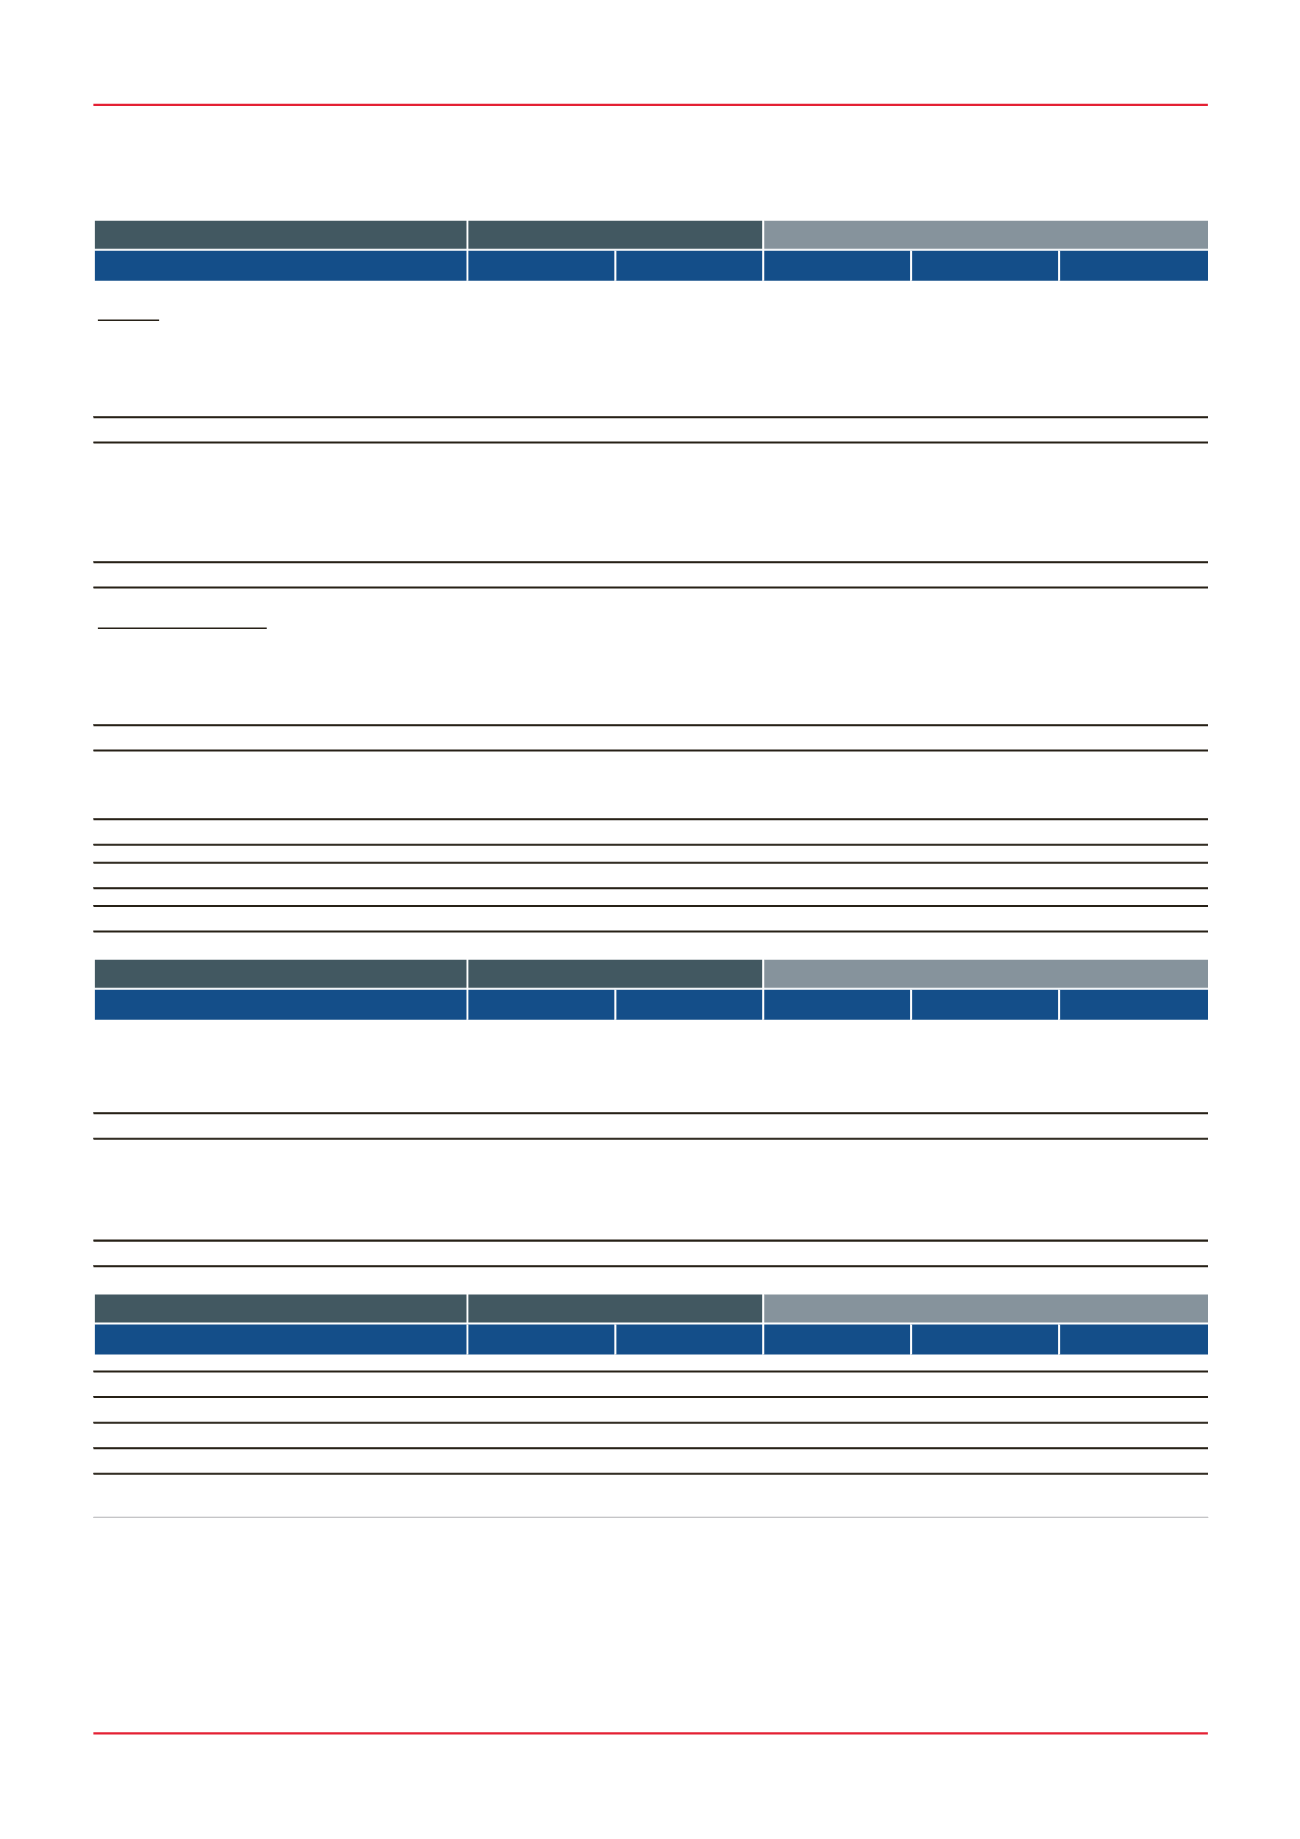
nbkcapital.com | 5FINANCIAL STATEMENTS*
Balance S heet
(KD 000s)
Fiscal Year E nds December
2013
2014
2015
2016
2017
AS S E TS
Cash
17,446
16,318
14,227
14,693
14,829
Prop. Held for Trading
86,386
98,751
61,145
25,284
5,408
Others
5,563
9,848
10,005
10,005
10,005
Total Current Assets
109,395
124,917
85,377
49,983
30,242
Investment Properties
89,095
109,129
126,625
128,424
130,146
AFS
12,751
12,073
11,314
11,314
11,314
Associates and J Vs
14,250
12,884
12,923
12,923
12,923
Goodwill & Others
2,625
2,885
2,888
2,897
2,910
TOTAL AS S E TS
228,116
261,889
239,127
205,541
187,535
LIABILITIE S & EQUITY
Customer Advances
68,663
79,657
55,147
20,576
2,150
S hort-Term Debt
6,887
8,504
5,000
5,000
5,000
Other Current Liabilities
12,524
9,132
14,496
14,496
14,496
Total Current Liabilities
88,074
97,293
74,643
40,072
21,646
Long-Term Debt
42,498
56,254
55,000
50,000
45,000
Other Liabilities
377
586
674
674
674
Total Liabilities
130,949
154,133
130,317
90,746
67,320
Total E quity
97,167
107,755
108,810
114,795
120,215
TOTAL LIABILITIE S AND EQUITY
228,116
261,889
239,127
205,541
187,535
Historic
Forecast
Income S tatement
(KD 000s)
Fiscal Year E nds December
2013
2014
2015
2016
2017
Total Revenue
25,976
16,665
54,963
59,275
43,632
Operating E xpenses
(21,783)
(14,395)
(43,017)
(45,868)
(31,114)
Income from Associates & JVs, excluding Turkey
310
1,629
112
118
118
Operating Income
4,503
3,898
12,058
13,525
12,636
Net Finance Charges
(2,558)
(2,484)
(3,587)
(3,419)
(3,118)
Net Impairment Charges
705
2,004
-
-
-
Net Investment & Revaluation Gains
4,885
3,523
943
-
-
Other
(1,533)
1,146
(568)
(644)
(629)
Net Profit
6,001
8,086
8,845
9,462
8,889
Historic
Forecast
Cash Flow S tatement
(KD 000s)
Fiscal Year E nds December
2013
2014
2015
2016
2017
Cash from Operating Activities
9,515
(3,200)
30,055
14,451
13,758
Cash from Investing Activities
(2,463)
(15,320)
(15,897)
(1,955)
(1,880)
Cash from Financing Activities
(2,737)
16,271
(16,250)
(12,030)
(11,742)
Forex Adjustments
(270)
108
-
-
-
Net Change in Cash
4,045
(2,140)
(2,091)
467
136
Historic
Forecast
*Excluding potential projects (such as in Oman) that Mazaya is currently evaluating. Source: Mazaya, NBK Capital