


 9 / 43

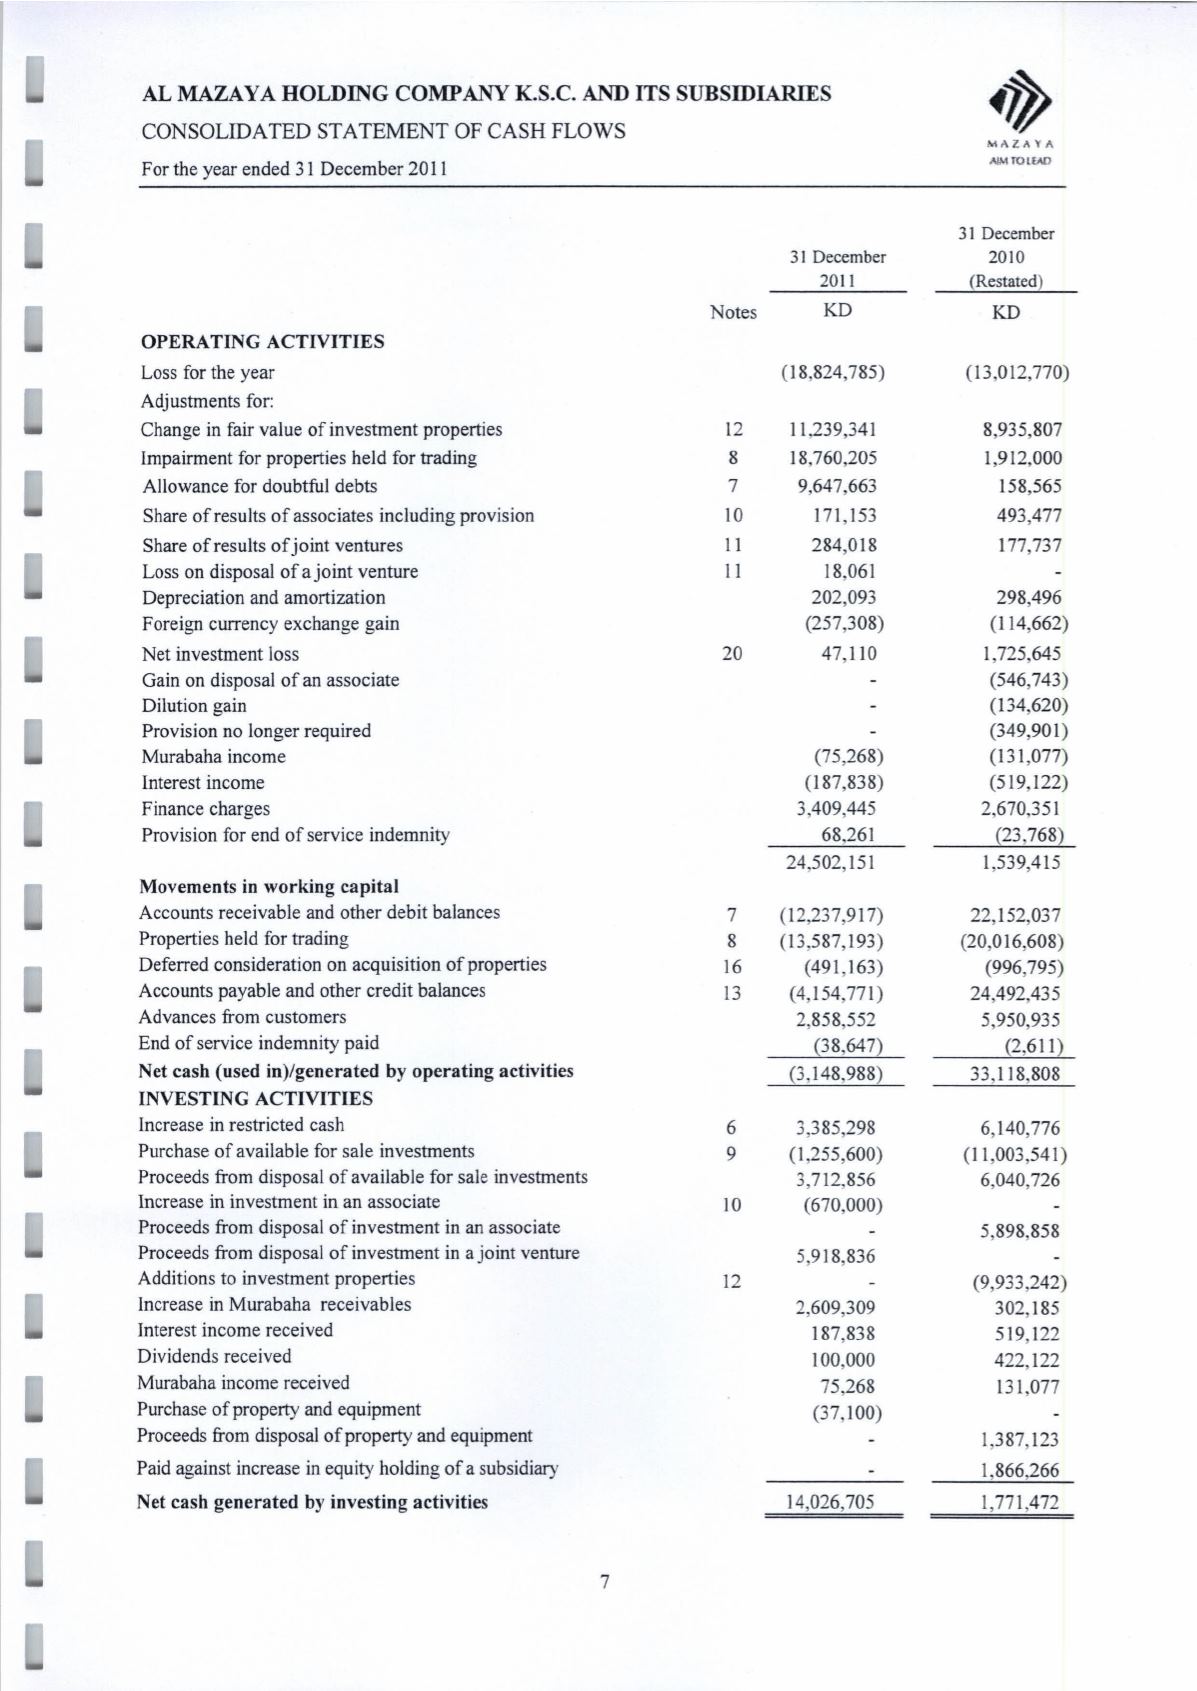
AL MAZAY A HOLDING COMPANY K.S.c. AND ITS SUBSIDIARIES
CONSOLIDATED STATEMENT OF CASH FLOWS
For the year ended 31 December 2011
MAZAYA
AIMfOlti\D
31 December
2011
Notes
KD
(18,824,785)
12
11,239,341
8
18,760,205
7
9,647,663
10
171,153
Il
284,018
11
18,061
202,093
(257,308)
20
47,110
OPERATING ACTIVITIES
Loss for the year
Adjustments for:
Change in fair value of investment properties
Impairment for properties held for trading
Allowance for doubtful debts
Share of results of associates including provision
Share of results of joint ventures
Loss on disposal of a joint venture
Depreciation and amortization
Foreign currency exchange gain
Net investment loss
Gain on disposal of an associate
Dilution gain
Provision no longer required
~urabahaincome
Interest income
Finance charges
Provision for end of service indemnity
(75,268)
(187,838)
3,409,445
68,261
24,502,151
7 (12,237,917)
8 (13,587,193)
16
(491,163)
13
(4,154,771)
2,858,552
(38,647)
(3,148,988)
6
3,385,298
9
(1,255,600)
3,712,856
10
(670,000)
5,918,836
12
2,609,309
187,838
100,000
75,268
(37,100)
Movements in working capital
Accounts receivable and other debit balances
Properties held for trading
Deferred consideration on acquisition of properties
Accounts payable and other credit balances
Advances from customers
End of service indemnity paid
Net cash (used in)/generated
by
operating activities
INVESTING ACTIVITIES
Increase in restricted cash
Purchase of available for sale investments
Proceeds from disposal of available for sale investments
Increase in investment in an associate
Proceeds from disposal of investment in an associate
Proceeds from disposal of investment in ajoint venture
Additions to investment properties
Increase in Murabaha receivables
Interest income received
Dividends received
Murabaha income received
Purchase of property and equipment
Proceeds from disposal of property and equipment
Paid against increase in equity holding of a subsidiary
Net cash generated
by
investing activities
14,026,705
7
31 December
2010
(Restated)
KD
(13,012,770)
8,935,807
1,912,000
158,565
493,477
177,737
298,496
(114,662)
1,725,645
(546,743)
(134,620)
(349,901)
(131,077)
(519,122)
2,670,351
(23,768)
1,539,415
22,152,037
(20,016,608)
(996,795)
24,492,435
5,950,935
(2,611)
33,118,808
6,140,776
(11,003,541)
6,040,726
5,898,858
(9,933,242)
302,185
519,122
422,122
131,077
1,387,123
1,866,266
1,771,472