


 8 / 16

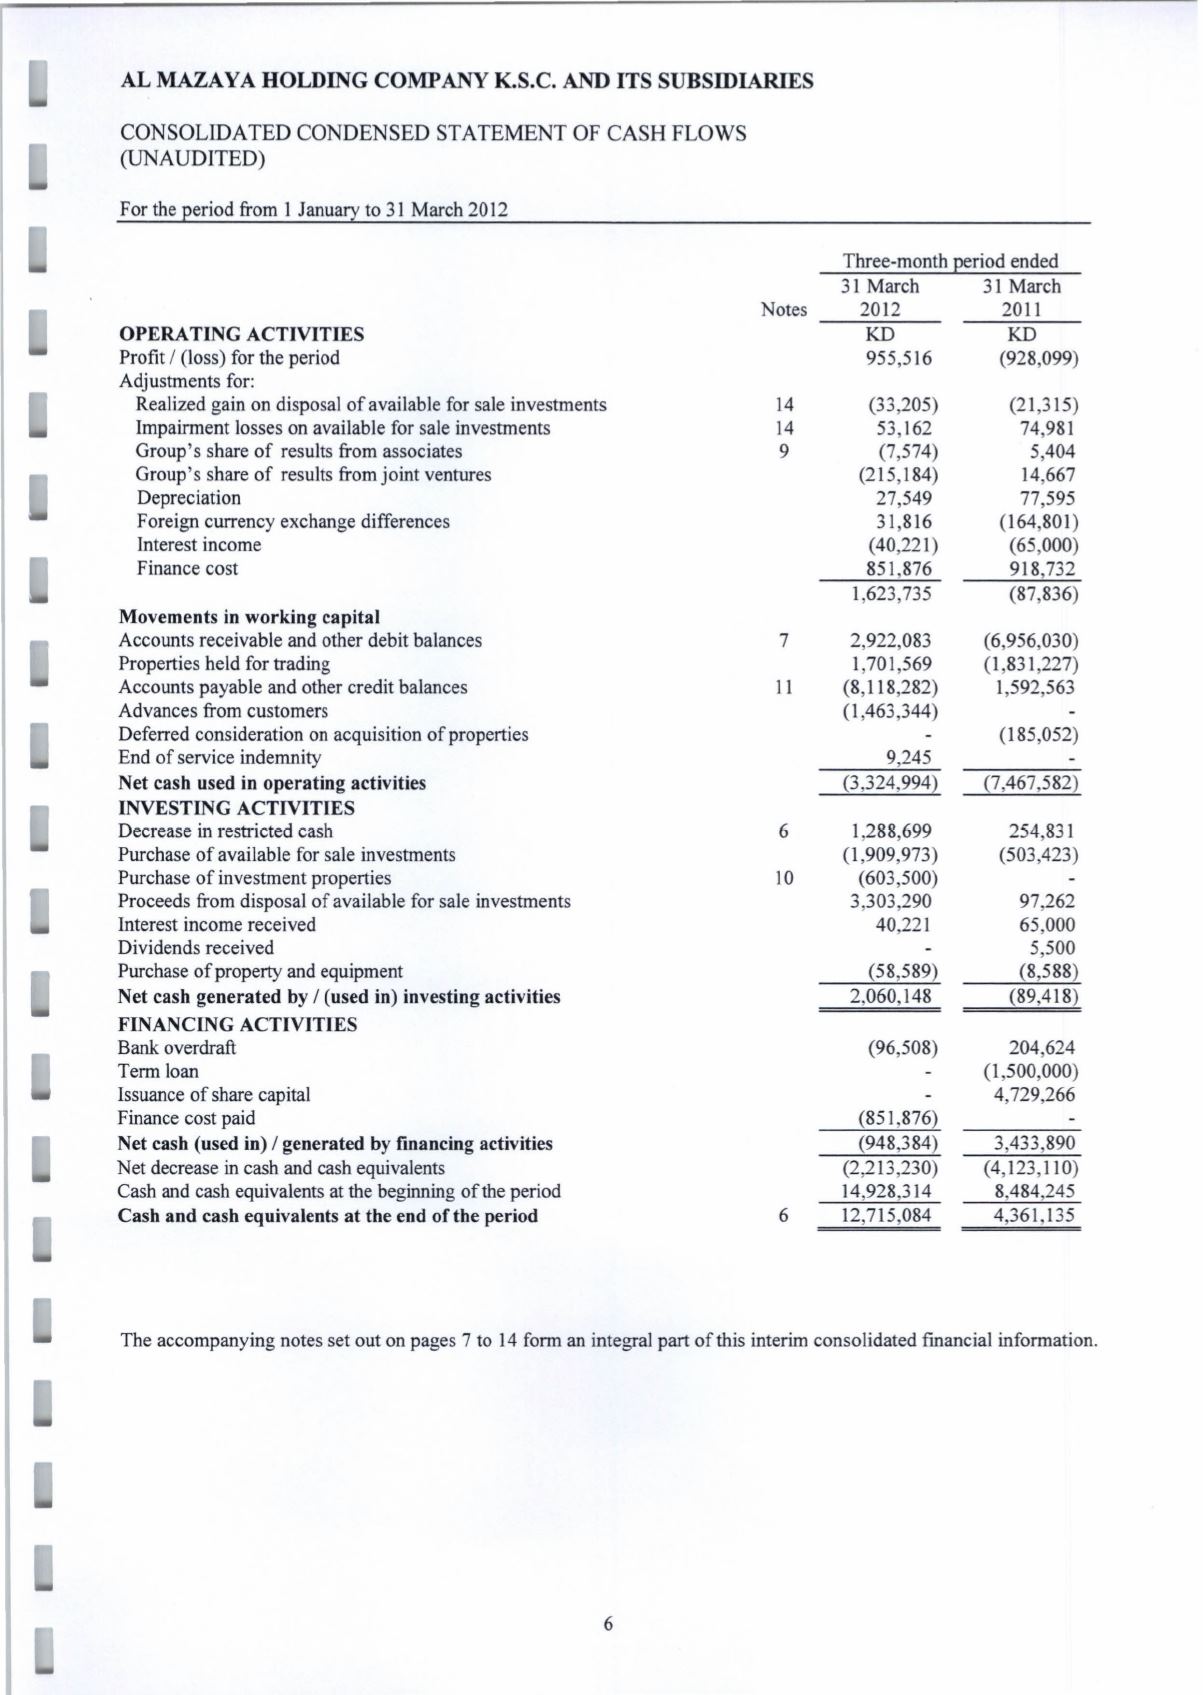
AL MAZAYA HOLDING COMPANY K.S.C. AND ITS SUBSIDIARIES
CONSOLIDATED CONDENSED STATEMENT OF CASH FLOWS
(UNAUDITED)
For the period from 1 January to 31 March 2012
Three-month period ended
31 March
31 March
Notes
2012
2011
OPERA TING ACTIVITIES
KD
KD
Profit
j
(loss) for the period
955,516
(928,099)
Adjustments for:
Realized gain on disposal of available for sale investments
14
(33,205)
(21,315)
Impairment losses on available for sale investments
14
53,162
74,981
Group's share of results from associates
9
(7,574)
5,404
Group's share of results from joint ventures
(215,184)
14,667
Depreciation
27,549
77,595
Foreign currency exchange differences
31,816
(164,801)
Interest income
(40,221)
(65,000)
Finance cost
851,876
918,732
1,623,735
(87,836)
Movements in working capital
Accounts receivable and other debit balances
7
2,922,083
(6,956,030)
Properties held for trading
1,701,569
(1,831,227)
Accounts payable and other credit balances
II
(8,118,282)
1,592,563
Advances from customers
(1,463,344)
Deferred consideration on acquisition of properties
(185,052)
End of service indemnity
9,245
Net cash used in operating activities
(3,324,994)
(7,467,582)
INVESTING ACTIVITIES
Decrease in restricted cash
6
1,288,699
254,831
Purchase of available for sale investments
(1,909,973)
(503,423)
Purchase of investment properties
10
(603,500)
Proceeds from disposal of available for sale investments
3,303,290
97,262
Interest income received
40,221
65,000
Dividends received
5,500
Purchase of property and equipment
(58,589)
(8,588)
Net cash generated
by
j
(used in) investing activities
2,060,148
(89,418)
FINANCING ACTIVITIES
Bank overdraft
(96,508)
204,624
Term loan
(1,500,000)
Issuance of share capital
4,729,266
Finance cost paid
(851,876)
Net cash (used in)
j
generated
by
financing activities
(948,384)
3,433,890
Net decrease in cash and cash equivalents
(2,213,230)
(4,123,110)
Cash and cash equivalents at the beginning of the period
14,928,314
8,484,245
Cash and cash equivalents at the end of the period
6
12,715,084
4,361,135
The accompanying notes set out on pages 7 to 14 form an integral part of this interim consolidated fmancial information.
6