


 12 / 16

AL MAZA YA HOLDING COMPANY K.S.C. AND ITS SUBSIDIARIES
INTERIM CONSOLIDATED FINANCIAL INFORMATION
(UNAUDITED)
For the period from 1 January to 31 March 2012
9.
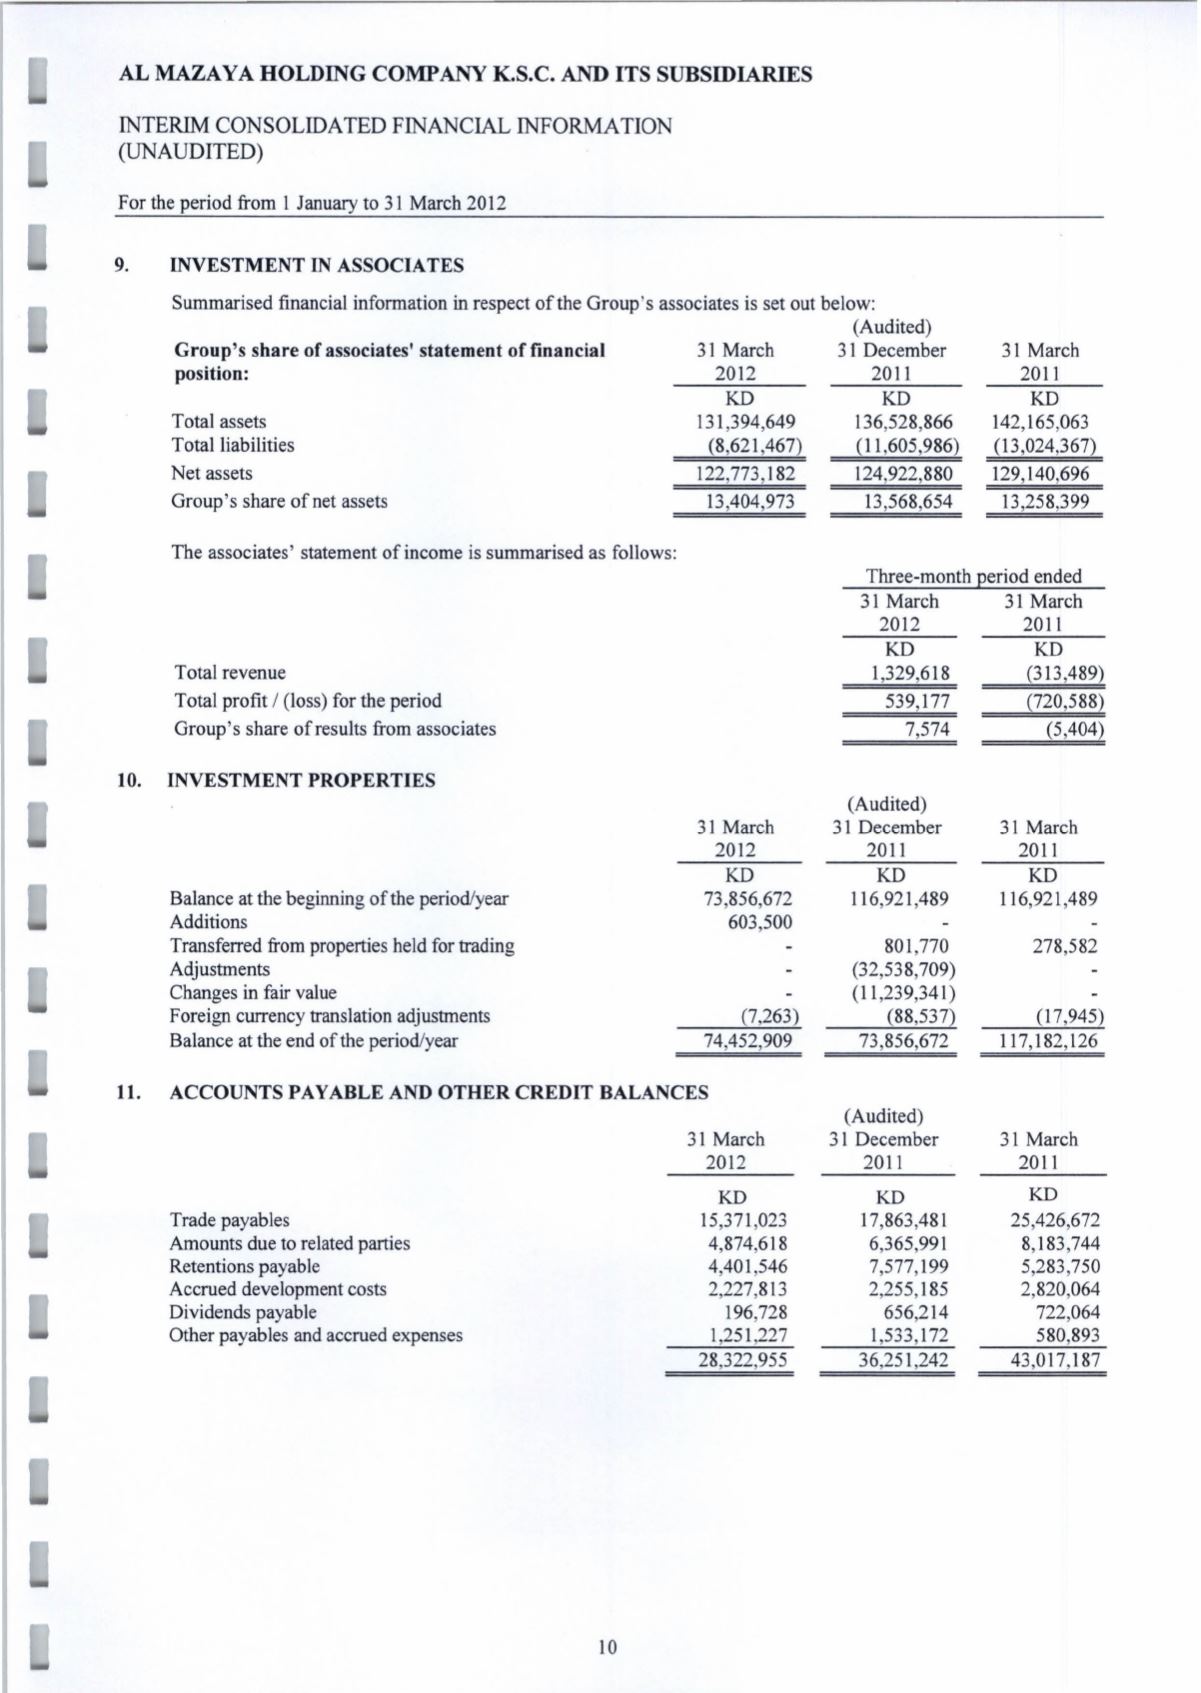
INVESTMENT IN ASSOCIATES
31 March
2012
Summarised financial information in respect of the Group's associates is set out below:
(Audited)
31 December
2011
KD
KD
Total assets
131,394,649
136,528,866
Total liabilities
(8,621,467)
(11,605,986)
Net assets
122,773,182
124,922,880
Group's share of net assets
13,404,973
13,568,654
Group's share of associates' statement of financial
position:
The associates'
statement of income is summarised as follows:
Total revenue
Total profit / (loss) for the period
Group's share of results from associates
10. INVESTMENT PROPERTIES
31 March
2012
KD
73,856,672
603,500
Balance at the beginning of the period/year
Additions
Transferred from properties held for trading
Adjustments
Changes in fair value
Foreign currency translation adjustments
Balance at the end of the period/year
(7,263)
74,452,909
11.
ACCOUNTS PAYABLE AND OTHER CREDIT BALANCES
31 March
2012
KD
15,371,023
4,874,618
4,401,546
2,227,813
196,728
1,251,227
Trade payables
Amounts due to related parties
Retentions payable
Accrued development costs
Dividends payable
Other payables and accrued expenses
28,322,955
10
31 March
2011
KD
142,165,063
(13,024,367)
129,140,696
13,258,399
Three-month period ended
31 March
31 March
2012
2011
KD
1,329,618
539,177
7,574
(Audited)
31 December
2011
KD
116,921,489
801,770
(32,538,709)
(11,239,341)
(88,537)
73,856,672
(Audited)
31 December
2011
KD
17,863,481
6,365,991
7,577,199
2,255,185
656,214
1,533,172
36,251,242
KD
(313,489)
(720,588)
(5,404)
31 March
2011
KD
116,921,489
278,582
(17,945)
117,182,126
31 March
2011
KD
25,426,672
8,183,744
5,283,750
2,820,064
722,064
580,893
43,017,187