
Page 63 - FS-Q2-2023-EN
P. 63
AL-MAZAYA HOLDING COMPANY - K.S.C. (PUBLIC) AND ITS SUBSIDIARIES
NOTES TO CONSOLIDATED FINANCIAL STATEMENTS
JUNE 30, 2023
(All amounts are in Kuwaiti Dinar)
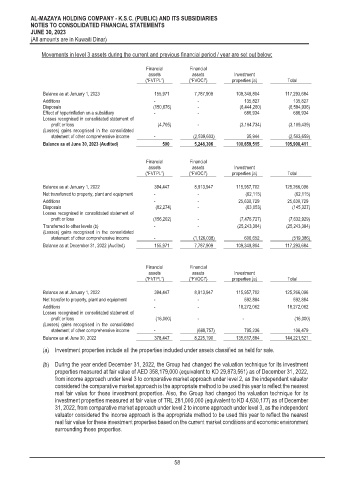
Movements in level 3 assets during the current and previous financial period / year are set out below:
Financial Financial
assets assets Investment
(“FVTPL”) (“FVOCI”) properties (a) Total
Balance as at January 1, 2023 155,971 7,787,909 109,349,804 117,293,684
Additions - - 135,827 135,827
Disposals (150,676) - (6,444,260) (6,594,936)
Effect of hyperinflation on a subsidiary - - 686,934 686,934
Losses recognised in consolidated statement of
profit or loss (4,705) - (3,104,734) (3,109,439)
(Losses) gains recognised in the consolidated
statement of other comprehensive income - (2,539,603) 35,944 (2,503,659)
Balance as at June 30, 2023 (Audited) 590 5,248,306 100,659,515 105,908,411
Financial Financial
assets assets Investment
(“FVTPL”) (“FVOCI”) properties (a) Total
Balance as at January 1, 2022 394,447 8,913,947 115,957,702 125,266,096
Net transferred to property, plant and equipment - - (62,115) (62,115)
Additions - - 25,630,729 25,630,729
Disposals (82,274) - (63,053) (145,327)
Losses recognised in consolidated statement of
profit or loss (156,202) - (7,476,727) (7,632,929)
Transferred to other levels (b) - - (25,243,384) (25,243,384)
(Losses) gains recognised in the consolidated
statement of other comprehensive income - (1,126,038) 606,652 (519,386)
Balance as at December 31, 2022 (Audited) 155,971 7,787,909 109,349,804 117,293,684
Financial Financial
assets assets Investment
(“FVTPL”) (“FVOCI”) properties (a) Total
Balance as at January 1, 2022 394,447 8,913,947 115,957,702 125,266,096
Net transfer to property, plant and equipment - - 592,884 592,884
Additions - - 18,272,062 18,272,062
Losses recognised in consolidated statement of
profit or loss (16,000) - - (16,000)
(Losses) gains recognised in the consolidated
statement of other comprehensive income - (688,757) 795,236 106,479
Balance as at June 30, 2022 378,447 8,225,190 135,617,884 144,221,521
(a) Investment properties include all the properties included under assets classified as held for sale.
(b) During the year ended December 31, 2022, the Group had changed the valuation technique for its investment
properties measured at fair value of AED 358,179,000 (equivalent to KD 29,873,561) as of December 31, 2022,
from income approach under level 3 to comparative market approach under level 2, as the independent valuator
considered the comparative market approach is the appropriate method to be used this year to reflect the nearest
real fair value for these investment properties. Also, the Group had changed the valuation technique for its
investment properties measured at fair value of TRL 281,000,000 (equivalent to KD 4,630,177) as of December
31, 2022, from comparative market approach under level 2 to income approach under level 3, as the independent
valuator considered the income approach is the appropriate method to be used this year to reflect the nearest
real fair value for these investment properties based on the current market conditions and economic environment
surrounding these properties.
58