


 90 / 95

ANNUAL REPORT
2015
Notes to The Consolidated Financial Statement
AL MAZAYA HOLDING COMPANY K.S.C.P. AND ITS SUBSIDIARIES
31 December 2015
Description of significant unobservable inputs to valuation of financial assets:
Managed portfolio and funds have been valued based on Net Asset Value (NAV) provided by the custodian of the fund. The
information relating to valuation techniques and significant unobservable inputs to valuation to compute the sensitivity of the fair
value measurement to changes in unobservable inputs in not available.
Non-financial assets
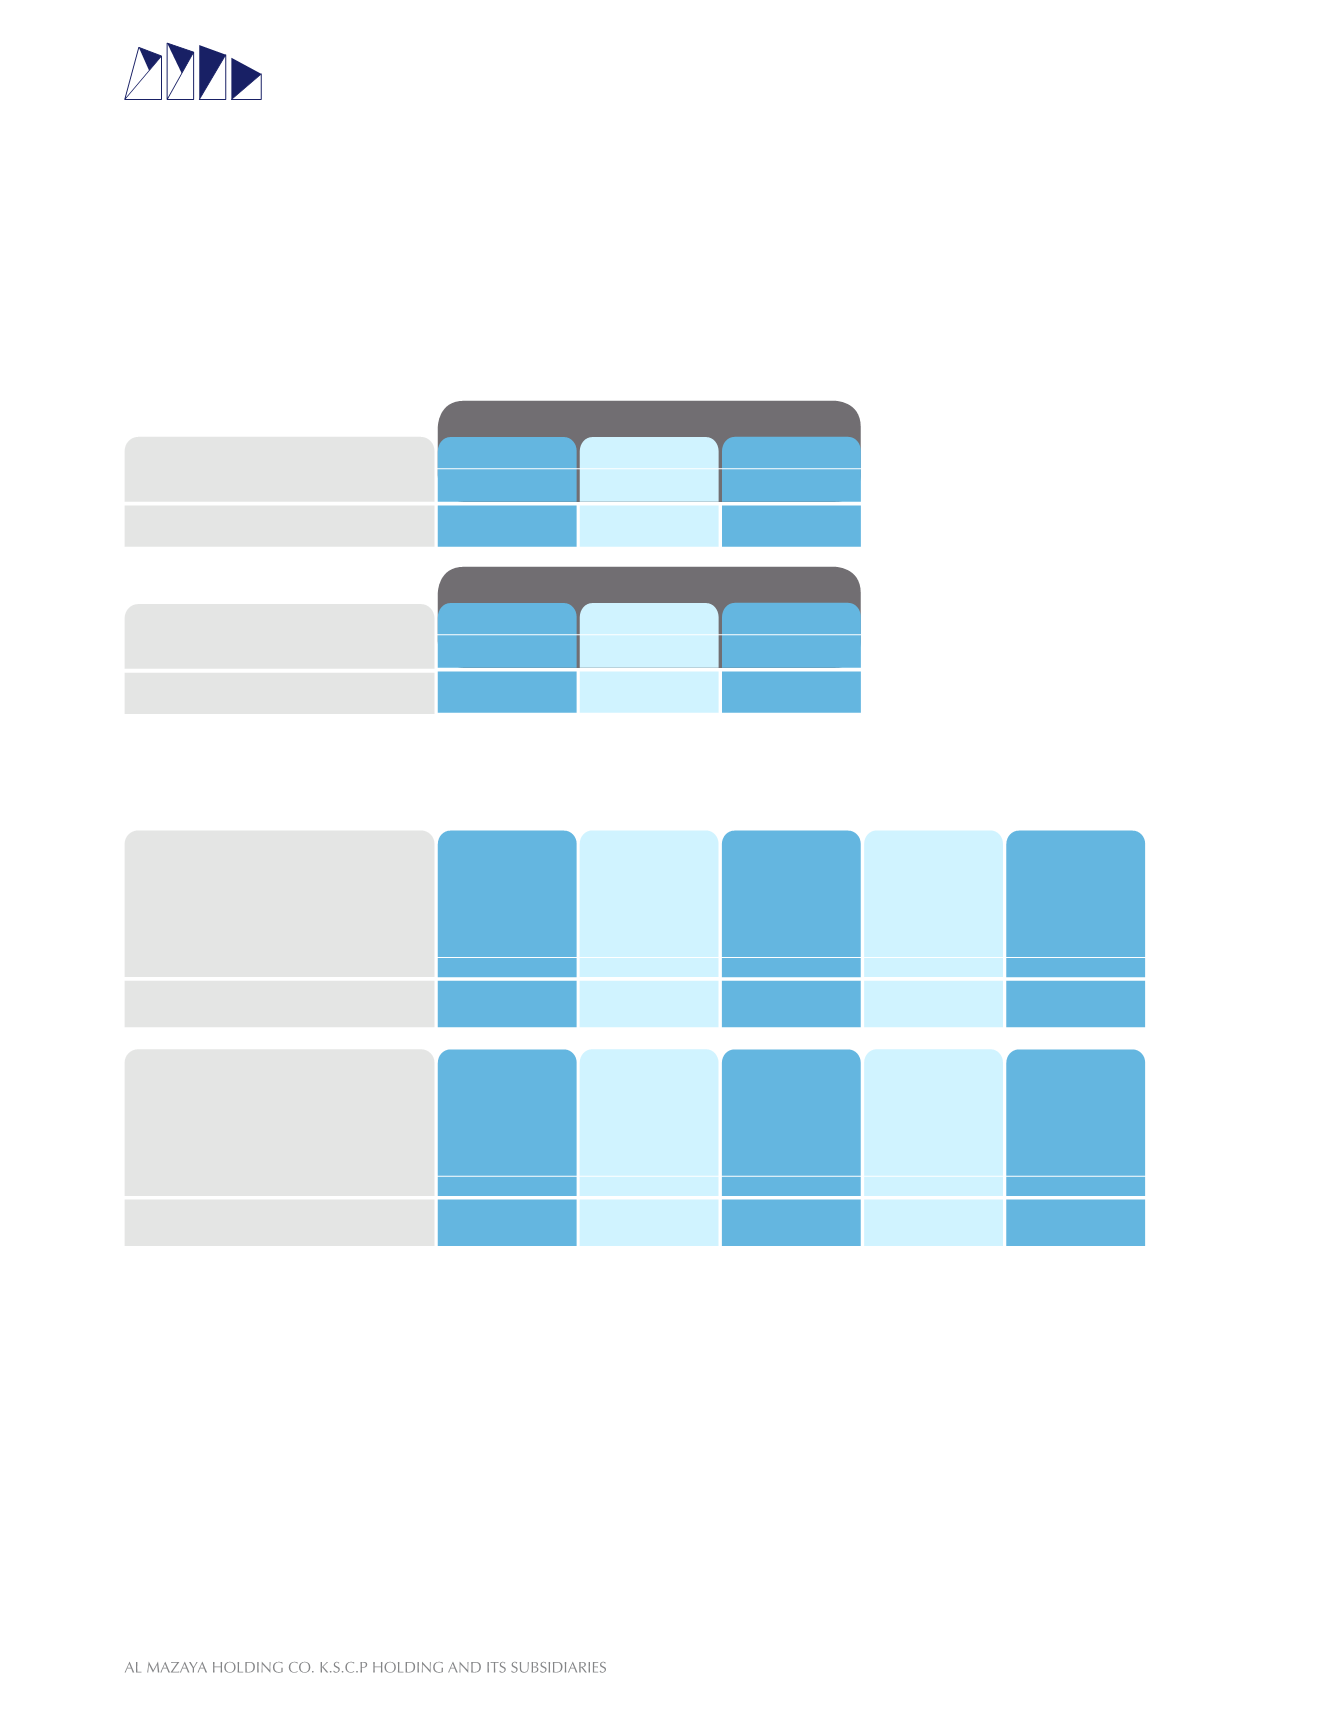
Investment properties were classified under level 2 and level 3 fair value hierarchy as follows:
The following table shows a reconciliation of the opening and closing amount of level 3 non-financial assets which are recorded
at fair value.
Fair value of investment properties were determined using Mark to Market method and capitalisation of rental income method.
The fair valuation was conducted by valuators considering transaction prices of similar properties in case of Mark to Market
method. The significant unobservable valuation input used is the market price per square foot and varies from property to property.
A reasonable change in this input would result in an equivalent amount of change in fair value.
Capitalisation of rental income method assumes capitalisation of annual rental income and the significant unobservable valuation
input used is the capitalisation rate in the range of 5.8% to 7% (2014: 5.8% to 9.5%). A 5% increase in this input would result in
an equivalent decrease in fair value.
Certain investment properties owned by the Group on Build Operate and Transfer (BOT) basis are valued using discounted cash
flow method.
86
2015
2014
155,006,585
92,312,256
Level 2
KD
Level 2
KD
Investment properties
Investment properties
Level 3
KD
Level 3
KD
Total
KD
Total
KD
50,553,670
41,814,250
64,452,915
50,498,006
11,659,025
)1,148,100(
At 1 January
2015
KD
At 1 January
2014
KD
Gain
recorded in the
consolidated
statement of
income
KD
Loss
recorded in the
consolidated
statement of
income
KD
Gain recorded
in other
comprehensive
income
KD
Gain recorded
in other
comprehensive
income
KD
Net
purchases,
sales and
settlements
KD
Net
purchases,
sales and
settlements
KD
At
31 December
2015
KD
At
31 December
2014
KD
423,536
)392,292(
50,498,006
50,634,871
1,872,348
1,403,527
64,452,915
50,498,006
Investment properties
Investment properties