


 11 / 16

Al Mazaya Holding Company K.S.C. and its Subsidiaries
NOTES TO INTERIM CONDENSED CONSOLIDATED FINANCIAL INFORMATION
(UNAUDITED)
At 30
June
2012
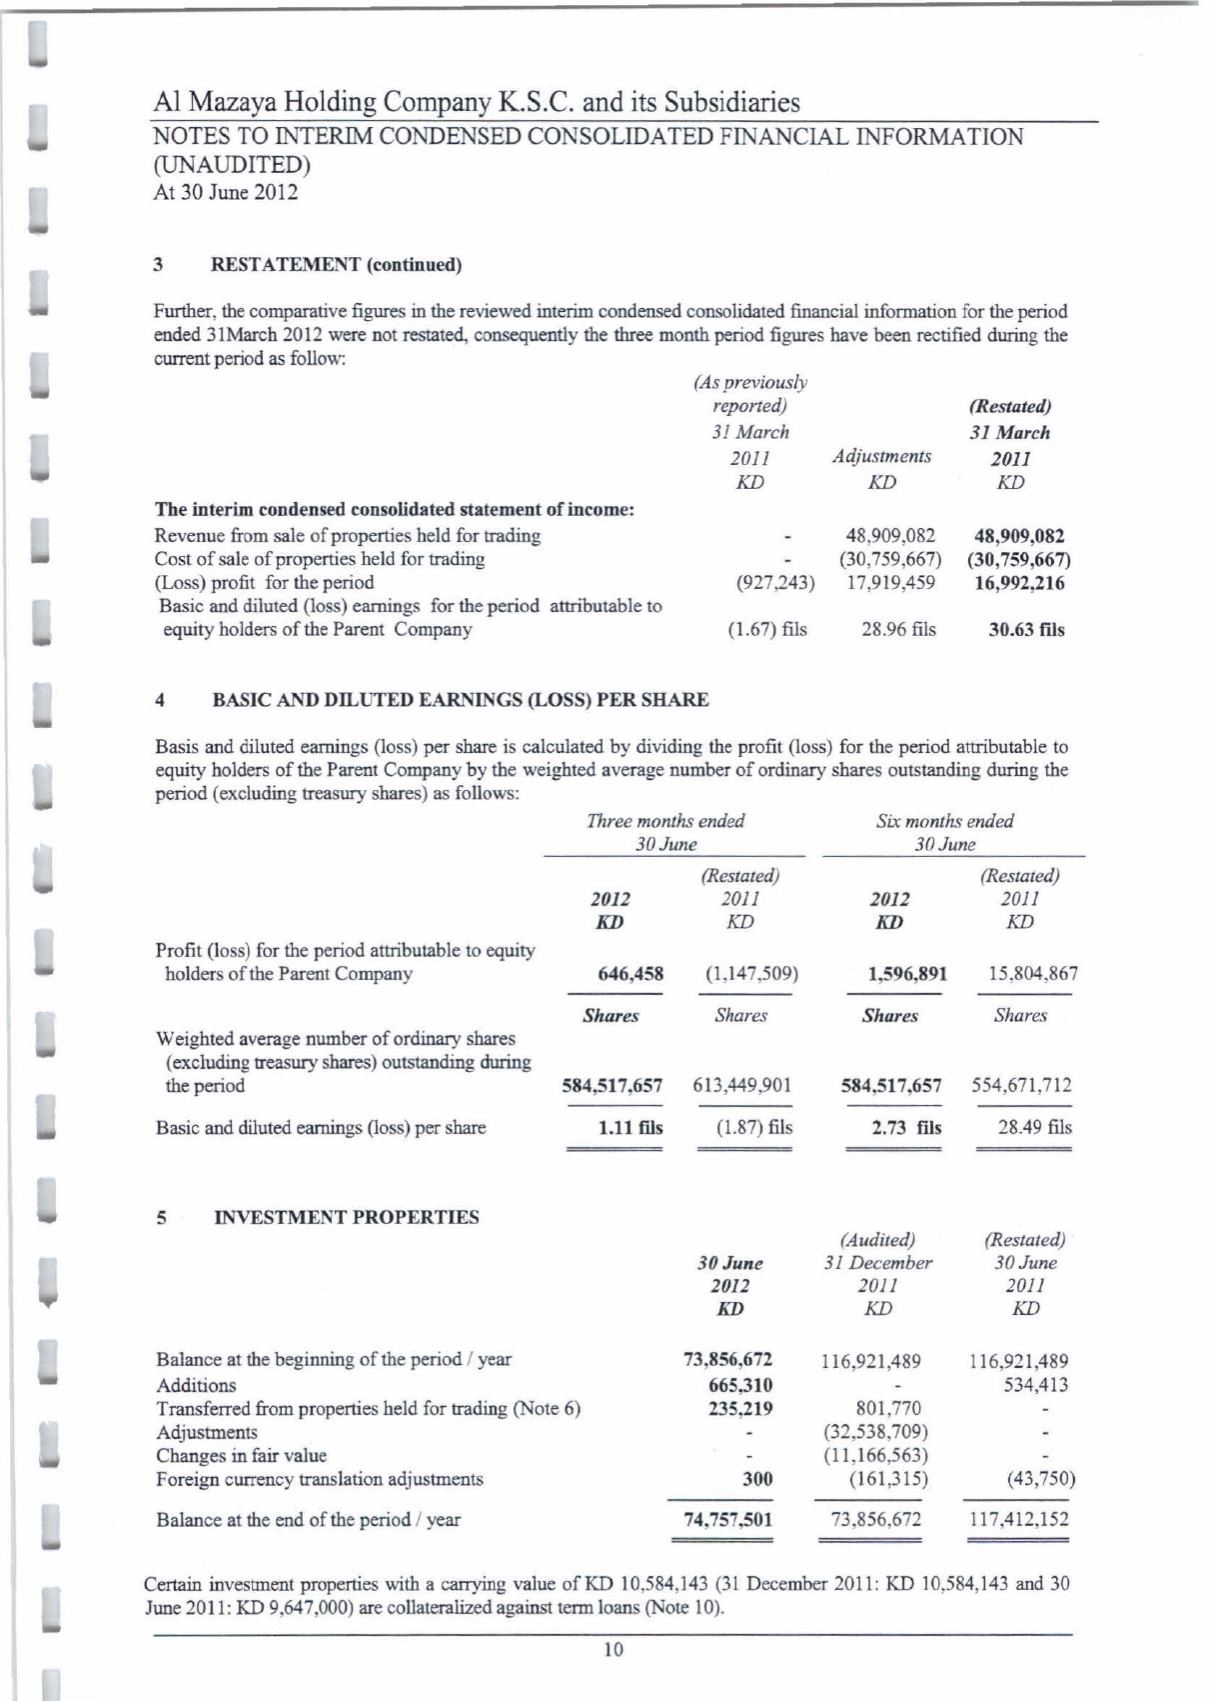
3
RESTATEMENT (continued)
Further, the comparative figures in the reviewed interim condensed consolidated financial information for the period
ended 31March 2012 were not restated, consequently the three month period figures have been rectified during the
current period as follow:
The interim condensed consolidated statement of income:
Revenue from sale of properties held for trading
Cost of sale of properties held for trading
(Loss) profit for the period
Basic and diluted (loss) earnings for the period attributable to
equity holders of the Parent Company
(As previously
reported)
(Restated)
31 March
31 March
2011
Adjustments
2011
KD
KD
KD
48,909,082
48,909,082
(30,759,667)
(30,759,667)
(927,243)
17,919,459
16,992,216
(1.67) fils
28.96 fils
30.63 fils
4
BASIC AND Dn..UTED EARNINGS (LOSS) PER SHARE
Basis and diluted earnings (loss) per share is calculated by dividing the profit (loss) for the period attributable to
equity holders of the Parent Company by the weighted average number of ordinary shares outstanding during the
period (excluding treasury shares) as follows:
Three months ended
30June
Six months ended
30June
(Restated)
2012
2011
KD
KD
(Restated)
2012
2011
KD
KD
Profit (loss) for the period attributable to equity
holders of the Parent Company
646,458
(1,147,509)
1,596,891
15,804,867
Shares
Shares
Shares
Shares
Weighted average number of ordinary shares
(excluding treasury shares) outstanding during
the period
584,517,657 613,449,901
Basic and diluted earnings (loss) per share
1.11
fils
(1.87) fils
584,517,657 554,671,712
2.73 fils
28.49 fils
5
INVESTMENT PROPERTIES
(Audited)
(Restated)
30June
31 December
30June
2012
2011
2011
KD
KD
KD
Balance at the beginning of the period / year
73,856,672
116,921,489
116,921,489
Additions
665,310
534,413
Transferred from properties held for trading (Note 6)
235,219
801,770
Adjustments
(32,538,709)
Changes in fair value
(11,166,563)
Foreign currency translation adjustments
300
(161,315)
(43,750)
Balance at the end of the period / year
74,757,501
73,856,672
117,412,152
Certain investment properties with a carrying value ofK.D 10,584,143 (31 December 2011:
KD
10,584,143 and 30
June 2011: K.D9,647,000) are collateralized against term loans (Note 10).
10