


 15 / 19

AL MAlAYA HOLDING COMPANY K.S.C. (HOLDING) AND ITS SUBSIDIARIES
NOTES TO THE INTERIM CONSOLIDATED FINANCIAL INFORMATION (UNAUDITED)
JUNE 30, 2010
(All amounts are in Kuwaiti Dinars)
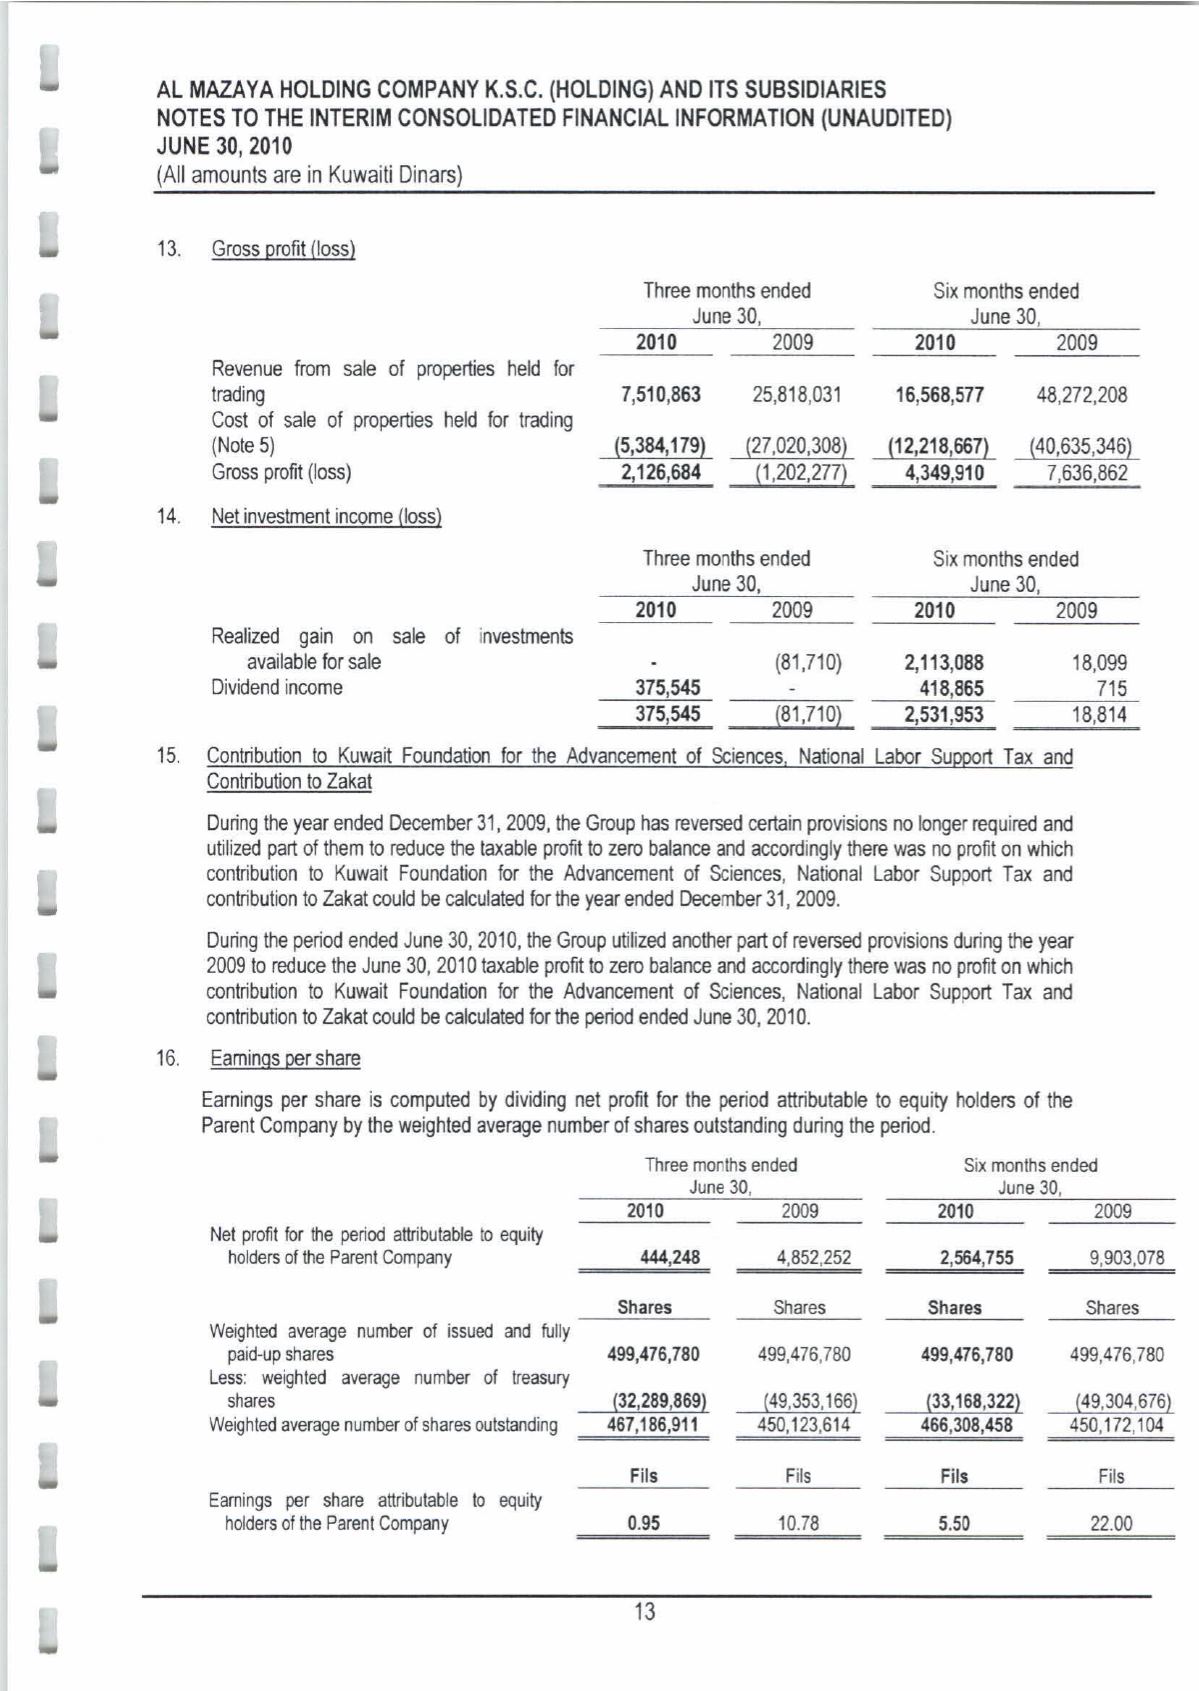
13.
Gross profit (loss)
Three months ended
June
30,
2010
2009
Revenue from sale of properties held for
trading
7,510,863
25,818,031
Cost of sale of properties held for trading
(Note
5)
(5,384,179} {27,020,308}
Gross profit (loss)
2,126,684
~1,202,277~
14.
Net investment income (loss}
Three months ended
June
30,
2010
2009
Realized gain on sale of investments
available for sale
Dividend income
(81,710)
375,545
375,545
(81,710)
Six months ended
June
30,
2010
2009
16,568,577
48,272,208
(12,218,667)
4,349,910
(40,635,346)
7,636,862
Six months ended
June
30,
2010
2009
2,113,088
418,865
18,099
715
2,531,953
18,814
15.
Contribution to Kuwait Foundation for the Advancement of Sciences, National Labor Support Tax and
Contribution to Zakat
During the year ended December
31, 2009,
the Group has reversed certain provisions no longer required and
utilized part of them to reduce the taxable profit to zero balance and accordingly there was no profit on which
contribution to Kuwait Foundation for the Advancement of Sciences, National Labor Support Tax and
contribution to Zakat could be calculated for the year ended December
31, 2009.
During the period ended June
30, 2010,
the Group utilized another part of reversed provisions during the year
2009
to reduce the June
30,2010
taxable profit to zero balance and accordingly there was no profit on which
contribution to Kuwait Foundation for the Advancement of Sciences, National Labor Support Tax and
contribution to Zakat could be calculated for the period ended June
30,2010.
16.
Eamings per share
Earnings per share is computed by dividing net profit for the period attributable to equity holders of the
Parent Company by the weighted average number of shares outstanding during the period.
Three months ended
Six months ended
June 30,
June 30,
2010
2009
2010
2009
Net profit for the period attributable to equity
holders of the Parent Company
444,248
4,852,252
2,564,755
9,903,078
Shares
Shares
Shares
Shares
Weighted average number of issued and fully
paid-up shares
499,476,780
499,476,780
499,476,780
499,476,780
Less: weighted average number of treasury
shares
(32,289,869}
(49,353,166}
(33,168,322}
(49,304,676)
Weighted average number of shares outstanding
467,186,911
450,123,614
466,308,458
450,172,104
Fils
Fils
Fils
Fils
Earnings per share attributable to equity
holders of the Parent Company
0.95
10.78
5.50
22.00
13