Notes to The Consolidated Financial Statements
AL MAZAYA HOLDING K.S.C. (HOLDING) AND ITS SUBSIDIARIES
For the year ended 31 December 2011
39
13,737,552
)5,195,704(
8,541,848
4,270,070
4,059,946
484,304
242,104
700,515
)2,007,565(
)1,307,050(
)627,384(
)812,162(
)821,037(
)394,098(
15,684,192
)860,738(
14,823,454
7,411,727
-
)51,486(
)25,743(
13,676,194
)4,606,476(
9,069,718
4,534,859
4,426,772
)358,044(
)178,986(
3,666,007
)3,787,190(
)121,183(
)58,168(
)104,481(
)108,043(
)51,861(
18,263,786
)3,741,834(
14,521,952
7,260,976
18,034
8,510
4,255
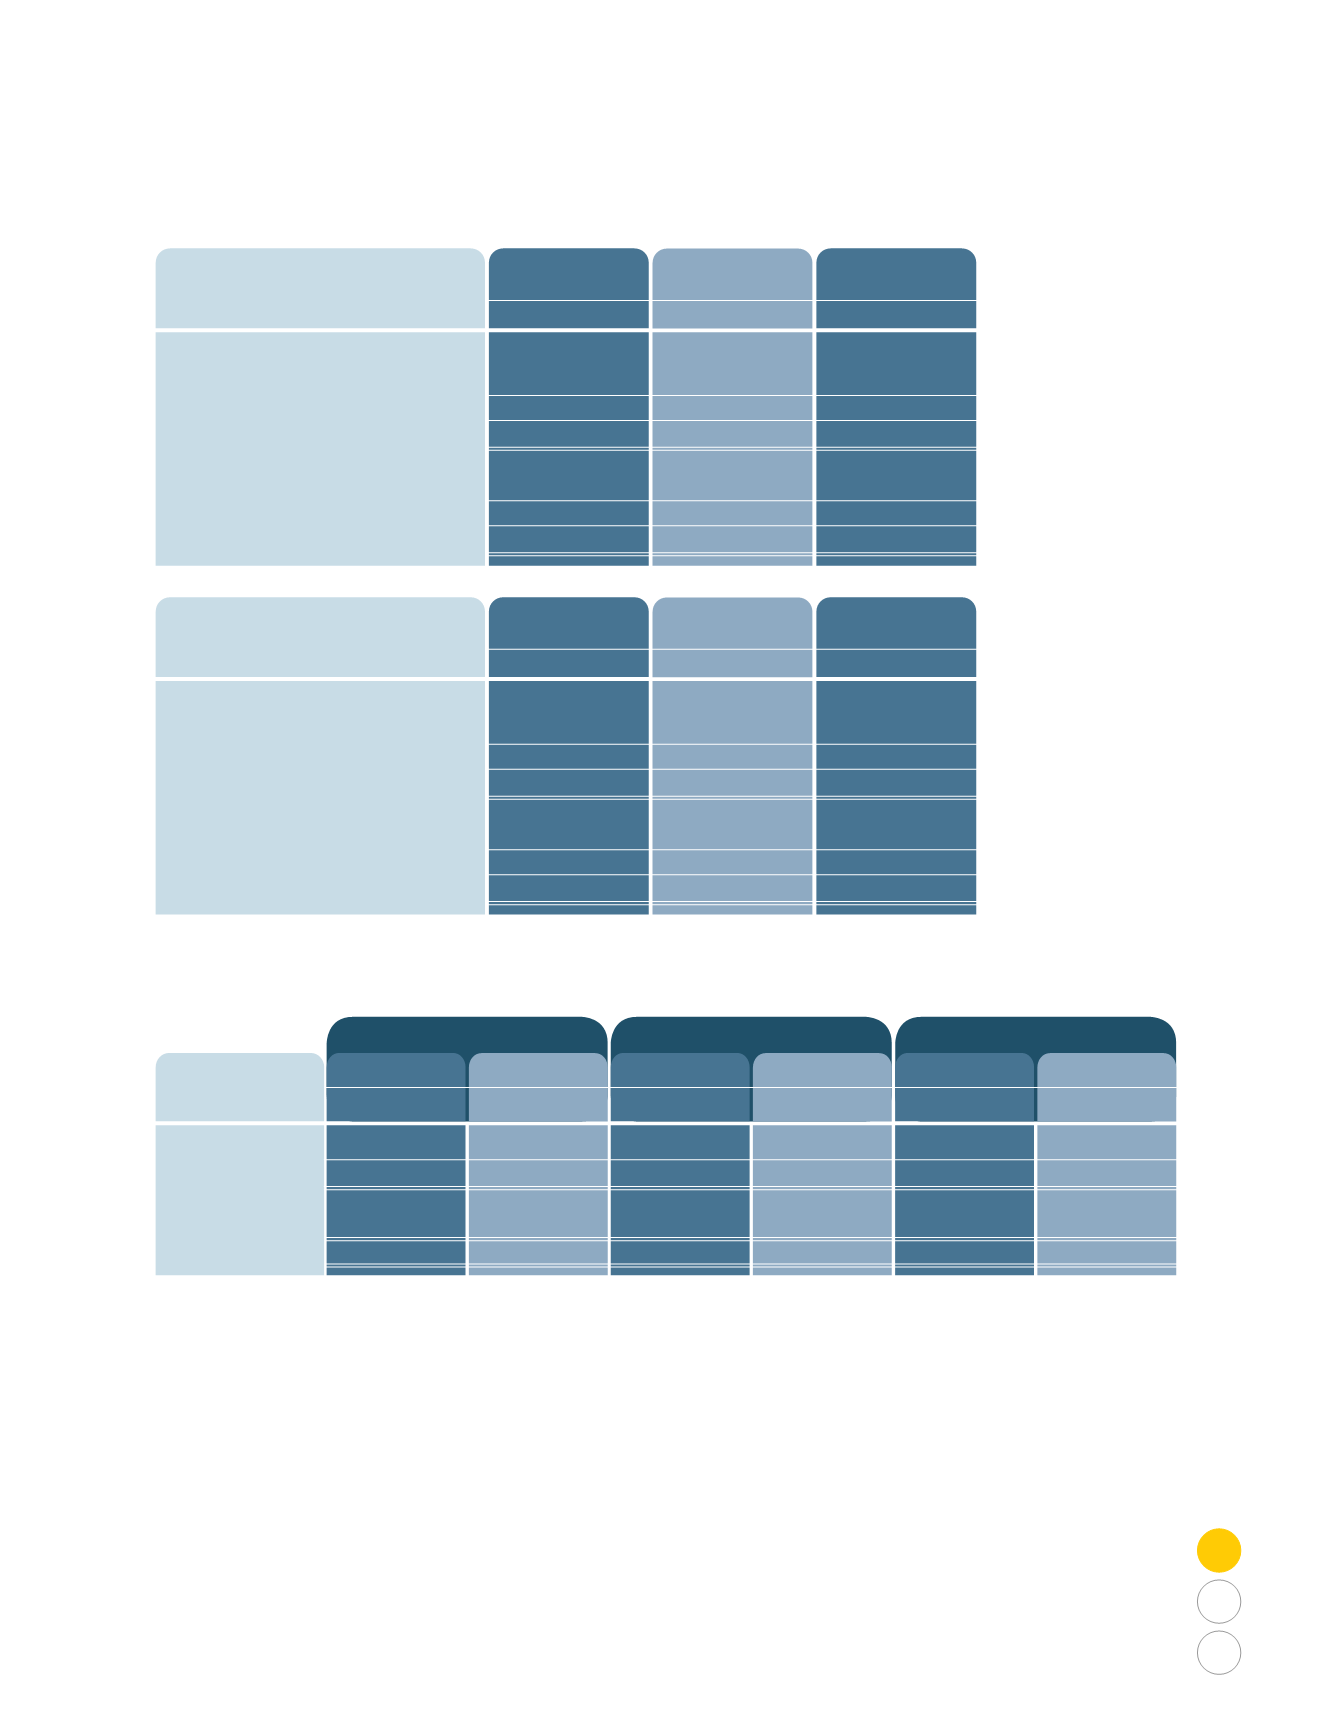
Assets
Liabilities
Net assets
Group’s share of net assets
Revenue
Profit / (loss) for the year
Group’s share of results
Assets
Liabilities
Net assets
Group’s share of net assets
Revenue
(Loss) / profit for the year
Group’s share of results
2010 (Restated)
2009 (Restated)
Al Madar
Gulf Limited
KD
Al Wahda Real Estate
Investment Limited
KD
Seven Zones
KD
Al Madar
Gulf Limited
KD
Al Wahda Real Estate
Investment Limited
KD
Seven Zones
KD
Included in the consolidated statement of financial position are jointly controlled operations pertaining to “Dubailand”
project in Dubai, financial details of which are as shown below:
2011
2009
2010
85,431,200
60,375,308
61,855,260
47,060,582
41,006,976
28,980,148
29,690,525
22,589,079
76,731,285
)53,351,155(
)55,618,846(
42,719,888
36,831,017
)25,608,555(
)26,697,046(
20,505,546
32,561,223
8,997,550
55,052,135
41,206,431
15,629,387
4,318,824
26,425,025
19,779,087
Assets
Liabilities
Revenue
Expenses
Group’s share
KD
Total
KD
Group’s share
KD
Total
KD
Group’s share
KD
Total
KD


