 
          Notes to The Consolidated Financial Statements
        
        
          AL MAZAYA HOLDING K.S.C. (HOLDING) AND ITS SUBSIDIARIES
        
        
          For the year ended 31 December 2011
        
        
          36


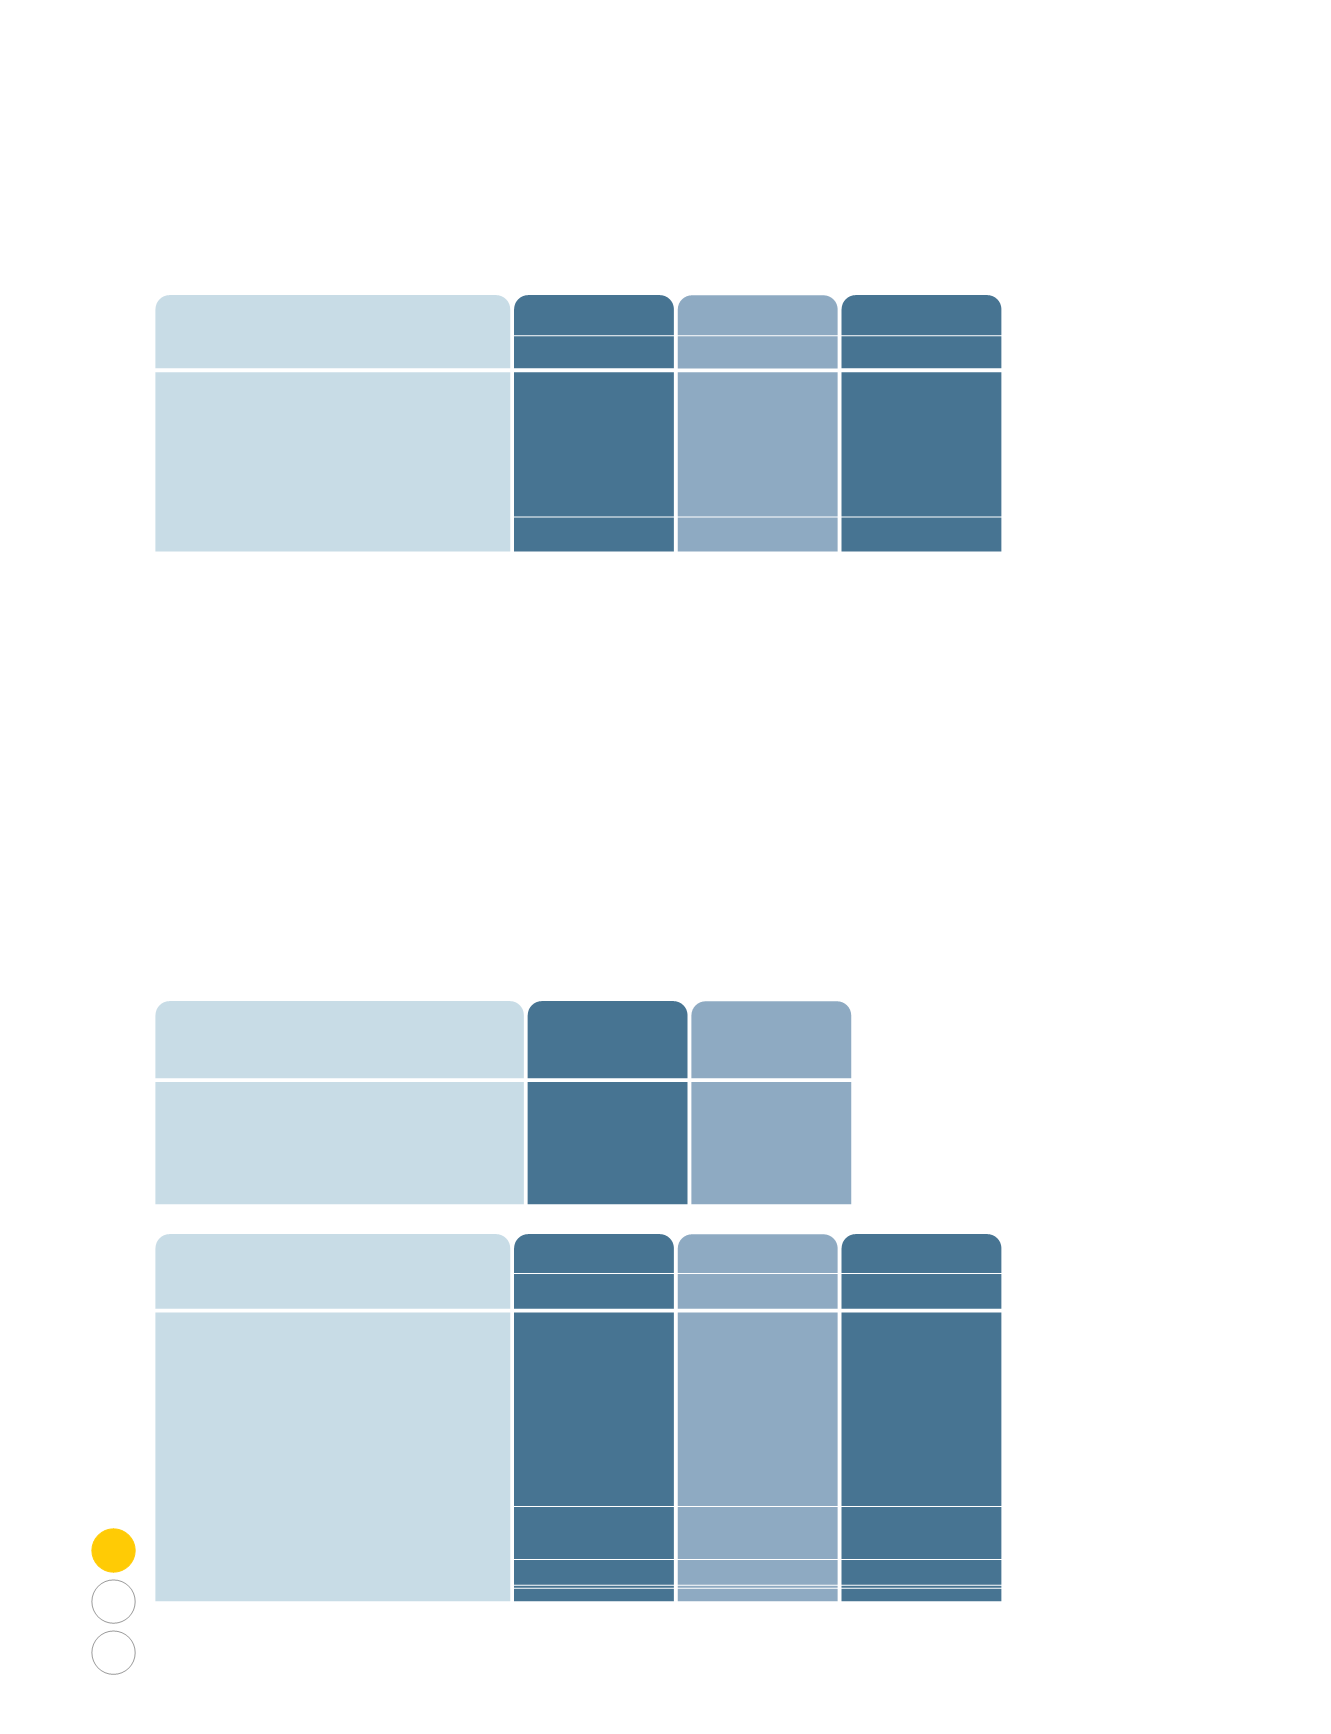
            9. AVAILABLE FOR SALE INVESTMENTS


          1,980,122
        
        
          4,580,179
        
        
          9,774,316
        
        
          16,334,617
        
        
          2,496,543
        
        
          4,419,702
        
        
          11,490,663
        
        
          18,406,908
        
        
          1,393,094
        
        
          17,235,067
        
        
          6,085,331
        
        
          24,713,492
        
        
          2011
        
        
          KD
        
        
          2010
        
        
          KD
        
        
          2009
        
        
          KD


            Quoted:


          Equity securities


            Unquoted:


          Equity securities
        
        
          Funds & Portfolios
        
        
          Available for sale investments with a fair value of KD 3,398,445 (31 December 2010: KD 13,340,787, 31 December 2009:
        
        
          Nil) are pledged against loans disclosed in note 14.
        
        
          Available for sale investments with a fair value of KD Nil (31 December 2010: 2,525,102, 31 December 2009: Nil) are
        
        
          pledged against a related party payable disclosed in note 13.
        
        
          Available for sale investments amounting to KD 702,883 (2010: Nil, 2009: KD 631,575) are carried at cost since the fair
        
        
          value could not be reliably determined.
        
        
          Impairment loss on available for sale investments of KD 455,904 (2010: KD 4,156,488, 2009: KD Nil) has been recognized
        
        
          in the consolidated statement of income.


            10. INVESTMENT IN ASSOCIATES


          The group exercises significant influence over the operating and financial policies of First Qatar Real Estate Development
        
        
          K.S.C (closed) through the group’s representation in the BOD of the company. Group also exercises significant influence
        
        
          over Mazaya Qatar Real Estate Development Q.S.C through management agreement that enables the Group to participate
        
        
          and influence the company’s operating and financial policies.
        
        
          Qatar
        
        
          Kuwait
        
        
          Jordan
        
        
          Mazaya Qatar Real Estate Development Q.S.C
        
        
          First Qatar Real Estate Development
        
        
          K.S.C.(Closed)
        
        
          Real Estate Development J.S.C.
        
        
          6.37
        
        
          17.54
        
        
          -
        
        
          Country of
        
        
          incorporation
        
        
          Ownership
        
        
          Percentage
        
        
          11,247,105
        
        
          8,569,475
        
        
          418,187
        
        
          (493,477)
        
        
          (6,129,727)
        
        
          134,620
        
        
          -
        
        
          13,746,183
        
        
          (482,380)
        
        
          13,263,803
        
        
          3,905,889
        
        
          6,676,330
        
        
          615,920
        
        
          48,811
        
        
          -
        
        
          -
        
        
          155
        
        
          11,247,105
        
        
          (832,281)
        
        
          10,414,824
        
        
          13,746,183
        
        
          -
        
        
          670,000
        
        
          (148,010)
        
        
          -
        
        
          -
        
        
          (193,996)
        
        
          14,074,177
        
        
          (505,523)
        
        
          13,568,654
        
        
          Balance at the beginning of the year
        
        
          Transferred from Investment available for sale
        
        
          Additions
        
        
          Group’s share of results for the year
        
        
          Disposal
        
        
          Dilution gain
        
        
          Foreign currency translation adjustments
        
        
          Provision
        
        
          Balance at the end of the year
        
        
          2011
        
        
          KD
        
        
          2010
        
        
          KD
        
        
          2009
        
        
          KD