
Page 6 - Q3-2024-EN
P. 6
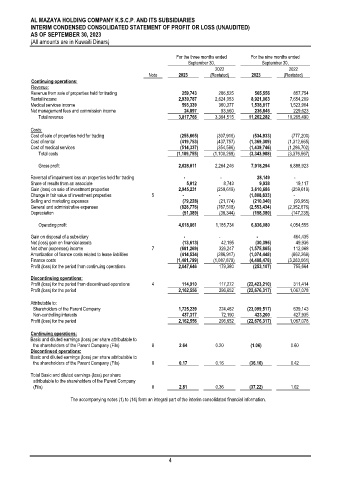
AL MAZAYA HOLDING COMPANY K.S.C.P. AND ITS SUBSIDIARIES
            INTERIM CONDENSED CONSOLIDATED STATEMENT OF PROFIT OR LOSS (UNAUDITED)
            AS OF SEPTEMBER 30, 2023
            (All amounts are in Kuwaiti Dinars)

                                                               For the three months ended      For the nine months ended
                                                                   September 30,             September 30,
                                                                             2022                     2022
                                                     Note       2023       (Restated)    2023        (Restated)
            Continuing operations:
            Revenue:
            Revenue from sale of properties held for trading         259,743     286,525     565,556     857,754
            Rental income                                       2,939,787     2,624,053     8,921,063     7,654,209
            Medical services income                              593,339      360,377     1,538,817     1,523,904
            Net management fees and commission income             24,897       93,560     236,846       229,623
               Total revenue                                    3,817,766     3,364,515     11,262,282     10,265,490

            Costs:
            Cost of sale of properties held for trading         (255,665)     (307,916)     (534,933)     (777,200)
            Cost of rental                                      (419,753)     (437,757)     (1,369,309)     (1,312,665)
            Cost of medical services                            (514,337)     (354,596)     (1,439,746)     (1,286,702)
               Total costs                                     (1,189,755)     (1,100,269)     (3,343,988)     (3,376,567)

               Gross profit                                     2,628,011     2,264,246     7,918,294     6,888,923

            Reversal of impairment loss on properties held for trading         -      -      28,149     -
            Share of results from an associate                     5,012        8,743       9,938        19,117
            Gain (loss) on sale of investment properties         2,945,231      (259,619)     3,610,686     (259,619)
            Change in fair value of investment properties   5      -          -          (1,808,833)     -
            Selling and marketing expenses                       (79,228)     (21,774)     (210,340)     (93,955)
            General and administrative expenses                 (828,776)     (767,518)     (2,553,434)     (2,352,676)
            Depreciation                                         (51,389)     (38,344)     (158,380)     (147,235)

               Operating profit                                 4,618,861      1,185,734      6,836,080     4,054,555

            Gain on disposal of a subsidiary                      -           -            -            464,435
            Net (loss) gain on financial assets                  (13,613)      42,195      (30,396)      49,936
            Net other (expenses) income               7         (681,269)     326,247      (1,575,865)     112,068
            Amortization of finance costs related to lease liabilities         (414,534)     (286,917)     (1,074,448)     (662,269)
            Finance costs                                      (1,461,799)     (1,087,879)     (4,408,478)     (3,263,061)
            Profit (loss) for the period from continuing operations          2,047,646      179,380      (253,107)     755,664

            Discontinuing operations:
            Profit (loss) for the period from discontinued operations    4      114,910      117,272      (22,423,210)     311,414
            Profit (loss) for the period                        2,162,556      296,652      (22,676,317)     1,067,078

            Attributable to:
             Shareholders of the Parent Company                 1,725,239      224,462      (23,099,517)     639,143
             Non-controlling interests                           437,317       72,190     423,200       427,935
            Profit (loss) for the period                        2,162,556     296,652     (22,676,317)     1,067,078

            Continuing operations:
            Basic and diluted earnings (loss) per share attributable to
             the shareholders of the Parent Company (Fils)   8   2.64        0.20        (1.06)        0.60
            Discontinued operations:
            Basic and diluted earnings (loss) per share attributable to
             the shareholders of the Parent Company (Fils)   8   0.17        0.16        (36.16)       0.42

            Total Basic and diluted earnings (loss) per share
             attributable to the shareholders of the Parent Company
             (Fils)                                   8         2.81         0.36        (37.22)       1.02

                          The accompanying notes (1) to (14) form an integral part of the interim consolidated financial information.


                                                            4