


 124 / 129

N
otes To The Consolidated Financial Statements
AL MAZAYA HOLDING K.S.C.P. AND ITS SUBSIDIARIES
As At 31 December 2016
ANNUAL REPORT
2016
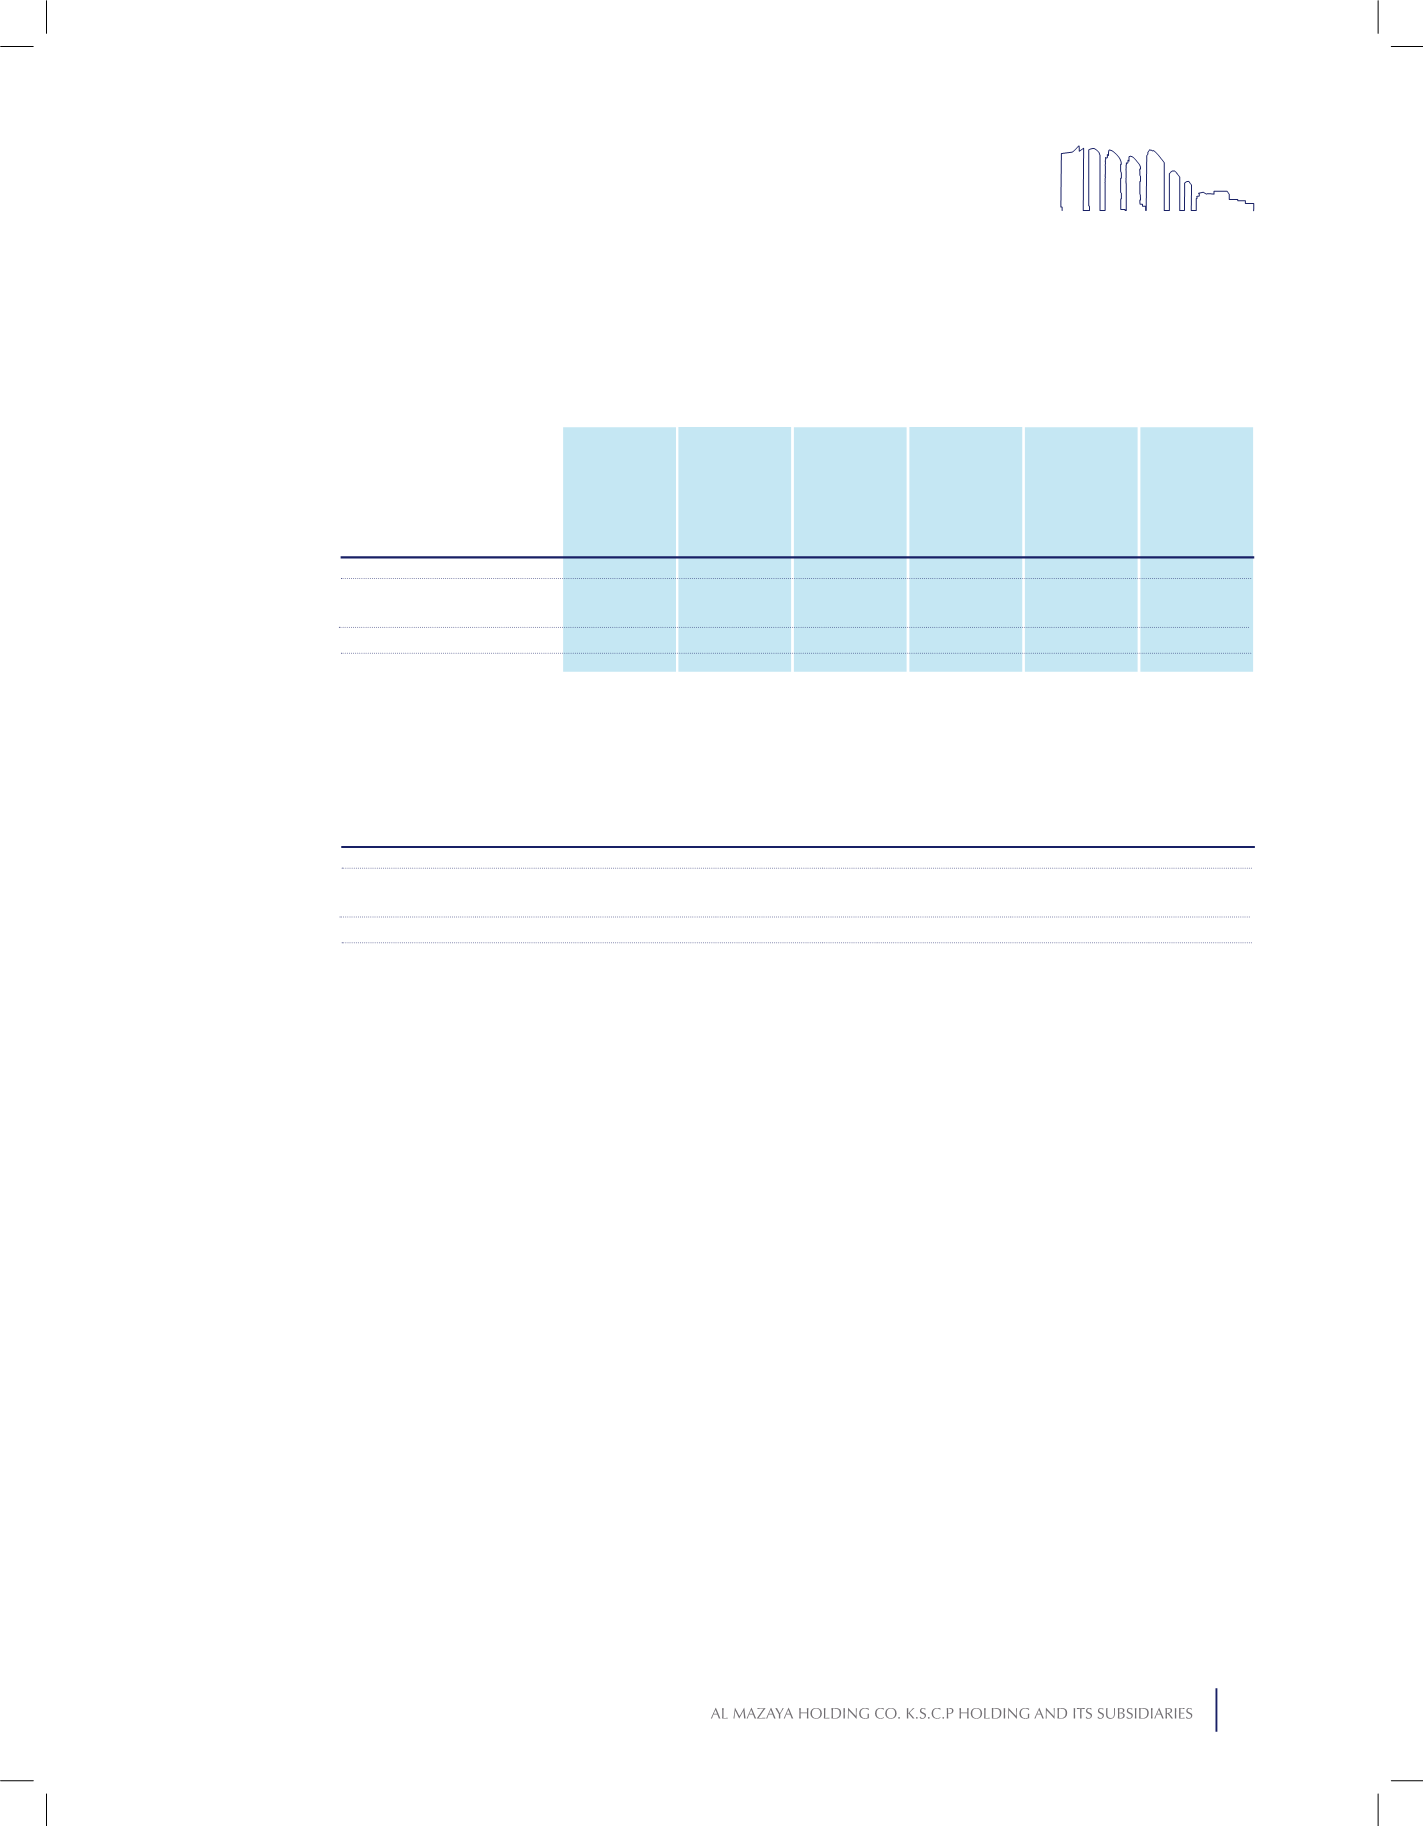
The following table shows a reconciliation of the opening and closing amount of level 3 non-financial assets which
are recorded at fair value:
Fair value of investment propertieswere determined using sales comparison approach and income capitalisation
approach. The fair valuation conducted by valuators considering transaction prices of the property and similar
properties in case of sales comparison approach and the significant unobservable valuation input used is the
market price per square foot and varies from property to property. A reasonable change in this input would
result in an equivalent amount of change in fair value.
Capitalisation of rental income method assumes capitalisation of annual rental income and the significant
unobservable valuation input used is the capitalisation rate in the range of 5.8% to 9.5% (2015: 5.8% to 7%).
A 5% increase in this input would result in an equivalent decrease in fair value.
Certain investment properties owned by the Group on Build Operate and Transfer (BOT) basis are valued
using discounted cash flow method.
At 1 January
2016
KD
At 1 January
2015
KD
Reclassification
from level 2 to
level 3
KD
Loss
recorded in the
consolidated
statement of
income
KD
Gain
recorded in the
consolidated
statement of
income
KD
Gain recorded
in other
comprehensive
income
KD
Gain recorded
in other
comprehensive
income
KD
Net purchases,
sales and
settlements
KD
Net purchases,
sales and
settlements
KD
At
31 December
2016
KD
At
31 December
2015
KD
Investment properties
Investment properties
64,452,915
50,498,006
31,463,371 )603,427(
423,536
472,064
1,872,348
12,528,106
11,659,025
108,313,029
64,452,915
121